 |
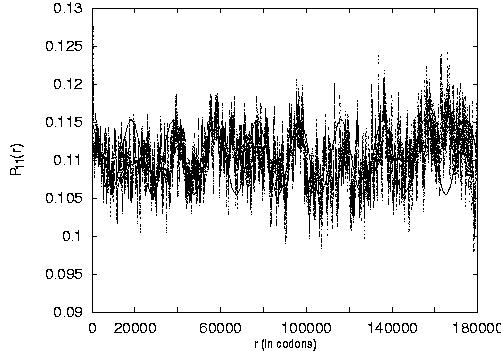
Figure 3: P11(r) vs. r for the Yeast chromosome II (the dots). The cosine plot is put to visualize one of the present periodicities.
|
Figure 3: P11(r) vs. r for the Yeast chromosome II (the dots). The cosine plot is put to visualize one of the present periodicities.
 Back to previous page