 |
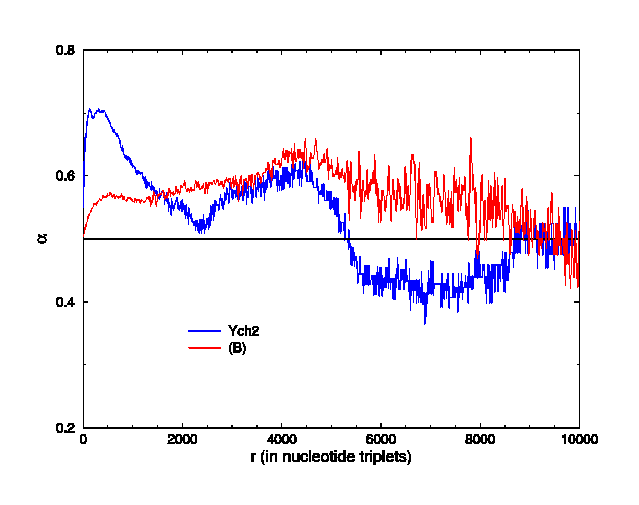
Figure 4: Local slope alpha for PP RW in phase (1) of Ych2 and random chromosomes (B). The curve for (B) represents the mean value of 500 random chromosomes from algorithm (B).
 |
Figure 4: Local slope alpha for PP RW in phase (1) of Ych2 and random chromosomes (B). The curve for (B) represents the mean value of 500 random chromosomes from algorithm (B).
 Back to previous page