 |
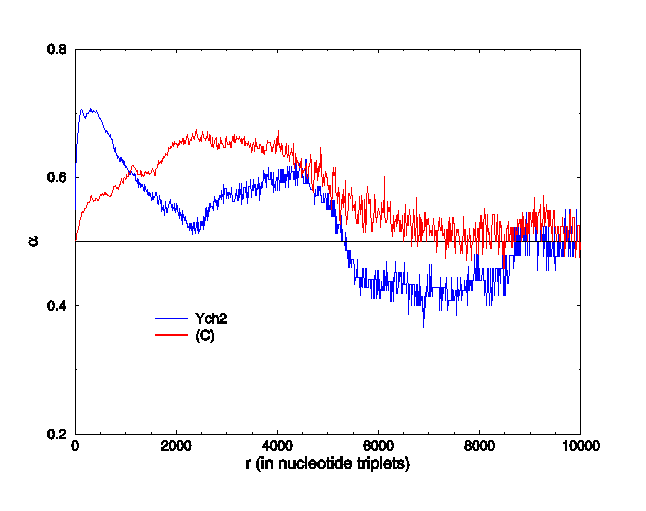
Figure 5: Local slope alpha for PP RW in phase (1) of Ych2 and random chromosomes (C). The curve for (C) represents the mean value of 6 random chromosomes from algorithm (C).
 |
Figure 5: Local slope alpha for PP RW in phase (1) of Ych2 and random chromosomes (C). The curve for (C) represents the mean value of 6 random chromosomes from algorithm (C).
 Back to previous page